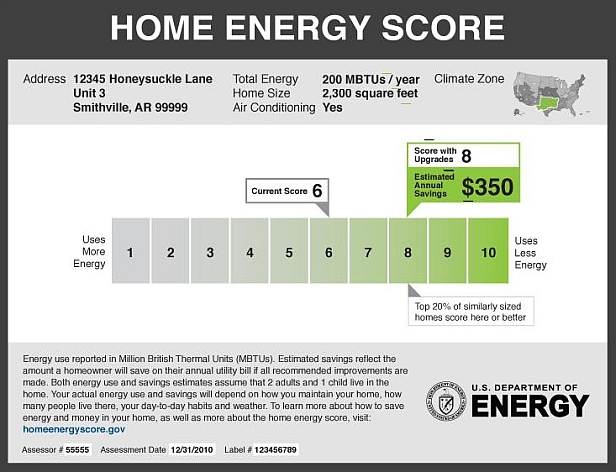
Over at the consistently interesting EnergySavvy.com, they’ve got a neat little post about the kind of cues that increase people’s participation in energy savings programs. They are helping the Department of Energy pilot test the new national Home Energy Score.
You can read their post for all the details; I’ll just pass along the conclusions. Not surprisingly, the things that work are all about increasing emotional and social relevance:
- Keep it simple: Simpler, friendlier language and less data always “won” our A|B test cases. In an industry full of building science nerds (and we use that term affectionately), we’ve all got to fight the urge to overwhelm homeowners with technical details and data. Research by Columbia University professor Sheena Iyengar showed a correlation between the number of 401K plan choices that employees at a company had with their participation rate: the more plan choices they had, the lower the participation rate was in any of the options.
- Personalize: Personalized language (“Your Home” and “Efficient Homes in Your Neighborhood” for example) and visuals performed well in our tests. It works to convince hotel guests to reuse their towels: “Other people who stay in this particular hotel room reused their towels at least once during their stay.” Maybe it’ll work to encourage home energy efficiency work.
- Make it Long-Term: Given multi-year measure lives of most energy efficiency improvements and the average tenure of homeowners, it seems legitimate to show a five-year savings estimate (at least!). While behavioral economics studies do show that people aren’t always motivated more when they are given more money, the fact that people were more motivated by the five-year savings number than the equivalent annual savings number fits with documented social psychology research. (In one study, subjects were willing to switch telephone providers for an average of $56 savings per year when the savings were presented as an annual number. But when the savings were presented as a monthly number, the average needed to be $11/month — the equivalent of $132/year!)