You have to hand it to the coal industry. They are not content to just spend millions of dollars on “wild and crazy” advertising claims about “clean coal.”
Now, they are bringing those same mad skills of deception to mapmaking. Yes, you read that right: We are now looking at lying via cartography.
This colorful map surfaced on Capitol Hill this week, purporting to show that most states would be hurt by the American Clean Energy and Security Act (ACES). Flogged during a press conference by Representatives Frank Lucas (R-OK), Sam Graves (R-MO), and Doc Hastings (R-WA), the map is an obvious attempt to scare legislators away from the ACES bill.
The blood-red colors showing the “carnage” the bill would supposedly cause really jump off the page, but as usual the coal industry is playing fast and loose here.
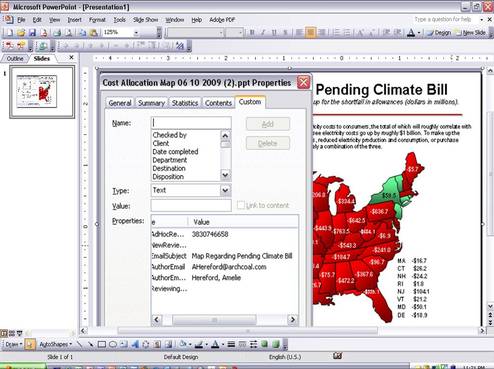
For example, one cannot tell the maker of the map just by looking at it. You have to probe a little deeper, as Grist did, to find out more where this map came from.
Click on the “Custom” tab of the “Properties” box on the file and you’ll find Arch Coal’s fingerprints in the form of an Arch Coal legislative staffer’s name and email address together with the subject “Map Regarding Pending Climate Bill.” (Amusingly, if you look under the “General” tab its evident that Arch cannibalized a map from an old Peabody investor presentation. Arch, you couldn’t afford your own map?)
You don’t have to be a brain surgeon to figure out the play here: Arch wants Congress to think that the ACES bill will cost a lot because they want to tilt the playing field to favor coal burning as much as possible. But their map is as phony as the claim that electricity consumers would be hurt.
That’s because Arch Coal is using phony math to exaggerate the cost of the bill by comparing each state’s electric generation emissions to the emissions allowances each state’s electricity consumers would get for free while ignoring other allowances states will get, also for free. The coal lobby wants us to believe that if a state has more emissions than allowances, the bill will cost the residents big-time.
But this is inaccurate and misleading for several reasons. For starters, electrons don’t stop at the state line. As my colleague Laurie Johnson explains, states sell power to their neighbors, and their neighbors’ neighbors. If you ignore electricity imports and exports, you get a phony picture of how electricity costs are actually spread around the country.
And in many states a lot of electricity is sold to industrial firms whose products are shipped all around the country and the world. That means the modest increases in total electricity bills in some states will be spread in tiny amounts over tens of millions of consumers of those goods outside the states where they are manufactured. (Laurie has some great charts showing this.)
Why do we say the bill increases are modest? Because the ACES bill also provides free allowances to many industries to protect them and their customers from increased electricity costs, which otherwise might result in unfair competition from overseas producers. But the coal lobby map ignores that too.
One more reason to be skeptical about the Arch map: It cites the Energy Information Administration and the Congressional Budget Office as its sources. A reader might assume that means the mapmaker got their #s for emission allowance allocations from those sources. But neither the EIA or CBO have calculated how much each state would get. So who knows who came up with the allocation breakdown the “analysis” ostensibly relies upon?
For a…well, fact-based picture of how ACES will affect electric bills, take a look at this map using data crunched by utility company consultant MJ Bradley. This map is a truer representation because it takes imports and exports into account, and puts the figure in terms of actual impacts on monthly electric bills. In most states, the electric bill impact is a few dimes a day.
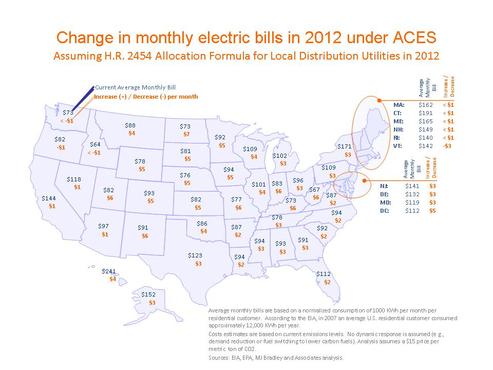
These results are broadly consistent with the EPA’s own modeling of the bill, which shows that for most people, the investment in clean energy will require about a dime per day.
But for those folks whose purchasing power is diminished by the impact of the legislation on electric bills, the bill provides direct cash refunds. This provision is so effective that the Center on Budget and Policy Priorities announced in a May 2009 news release about the bill “The consumer refund, in combination with the allocations to utility companies under the Waxman-Markey bill, would succeed in fully offsetting the average loss of purchasing power that low-income households would face, adjusted for household size.”
And that doesn’t even count the fact that the federal energy efficiency provisions included in the bill could save approximately $750 per household by 2020 and $3,900 per household by 2030, according to a preliminary analysis by the American Council for an Energy-Efficient Economy (ACEEE). Savings from reduced energy use will be reinvested locally, generating economic activity and jobs. Many agree that these savings are conservative estimates of the savings that consumers will see.
The lesson here? We already knew we can’t trust coal industry TV ads. And now we know that we can’t trust their maps.