Dear Umbra,
How come it’s so expensive to go organic? I could swing it by myself by eating a bare minimum of food, but I’m charged with feeding consume-mass-quantity types who favor the traditional American diet, and they eat meat. I would be in debt buying just half the monthly food consumption. One would have to be rich to go organic.
MonikkaMarie Jackson
Queen Village, N.Y.
Dearest MonikkaMarie,
The usual answer to your question from organic proponents is: organic isn’t expensive, conventional is unrealistically cheap. Not that helpful, but it’s true.
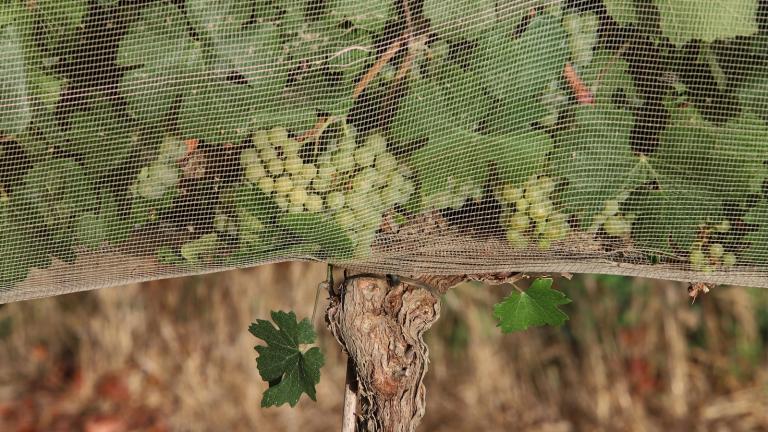
It doesn’t make cents.
Photo: iStockphoto.
In the United States, a very small percentage of income goes toward purchasing food: less than 10 percent in 2004, compared with 23 percent in 1929 (and 24 percent in modern Mexico). You probably know that the federal and state governments heavily participate in and financially support U.S. agricultural production. I’ve been told this is a legacy of the Depression, sort of an “as God is our witness, we’ll never go hungry again” attitude. Prices for our food are low and consistent because of strong government involvement in the form of subsidies, grants, paying not to produce, buying surplus, supporting technological development, and tax incentives. Look back at my scintillating discussion of oil subsidies, which describes the various ways government can ease the path of any industry. We pay twice for our food: once to the IRS and once at the supermarket. In short, the cheapness of food is a delusion.
Organic agriculture, by and large, has not received and does not receive the same amount of governmental support as conventional. Organic accounts for about 2 percent of total food sales in the United States. Many organic farms are too small to participate in government programs aimed at huge operations, and their diverse crops don’t qualify for support aimed at monolithic growers of corn and such.
Inherent aspects of organic farming are simply costly: chemical fertilizers are great on a huge farm, because you can just add them to the irrigation system. With organic, the “inputs” — the prices of labor, fertilizer, pest management, seed, baby animals — are in most cases more expensive than for conventional products. Imagine the difference in cost to the farmer: adding gallons of liquid to the irrigation pipes versus buying and applying tons of compost using human labor.
I will finally say that organic food purveyors — not farmers, but middlemen and groceries — are happy to take advantage of the laws of capitalism. Charge as much as you can get.
So there you go. Organic food is more expensive because it costs more to produce, has less support from the government, supply is less than demand, and in general we pay the true cost of food when we buy organic. When we buy conventional, we pay the fake cost of food.
If you can’t afford an all-organic diet, buy only priority items organic — again, visiting my past musings might be helpful. Also, check out the Environmental Working Group’s report card (and handy wallet guide [PDF]) listing produce items that are often heavily contaminated with pesticides and produce items that aren’t. The oft-contaminated ones — such as apples, celery, and potatoes — should be your top priority if you’re going to buy just a few organic items.
You know, going veggie is a very useful, highly effective environmental step. And it can be cheaper than going organic. Though the meat-eating mass-quantity types might not approve.
Beanily,
Umbra