It’s fairly well-known that economic activity tends to track energy use. It follows that we can learn some interesting things about the economy by examining trends in energy use.
For example: the Energy Department’s Energy Information Administration (EIA) tracks electricity sales, and its data holds intriguing — and troubling — clues on the prospects for growth in the U.S. economy.
In the U.S., electricity sales grow at a steady 1-2 percent rate per year, with occasional troughs mapping to slowdowns in economic activity.
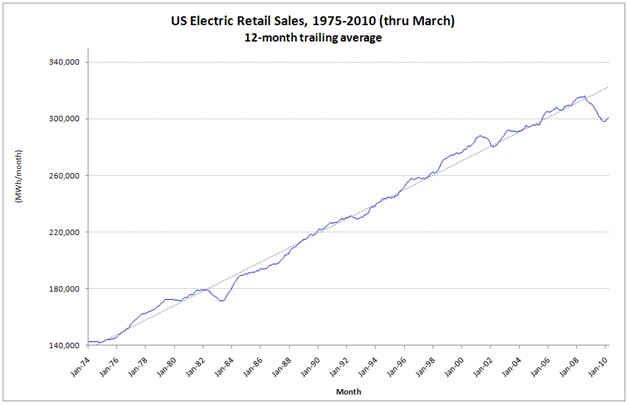 Note the dips during the S&L crisis in the early ’80s, the first Gulf War in the early ’90s, the Enron/dotcom bubble/9-11 downturn in the early 2000s, and the current recession. Note that in all cases, demand eventually returned to the trend rate of growth. Note also that the recent fall-off is as deep as we’ve seen in four decades, though it does appear to have bottomed out.
Is this time different?
During bubbles, we tell ourselves that the economic cycle has been tamed. During recessions, we’re prone to discussions of permanent, structural slowdowns. Long-term trends encourage skepticism with respect to both. Nonetheless, there are some revealing trends in how different sectors of the economy have curtailed their electricity use through historic recessions.
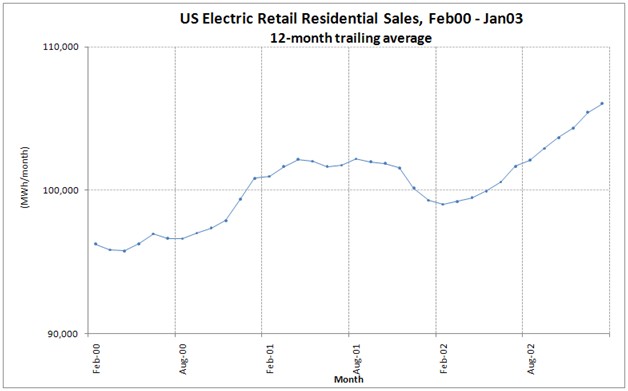
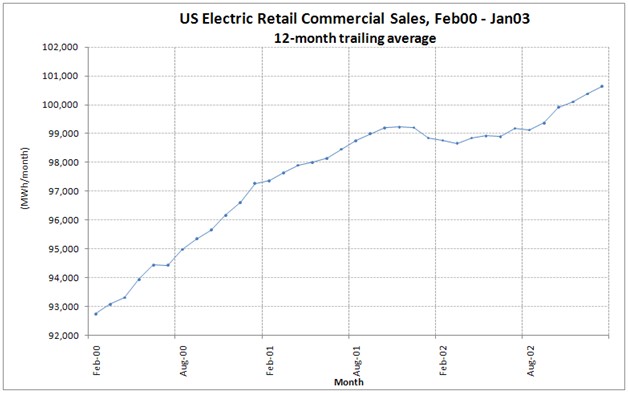
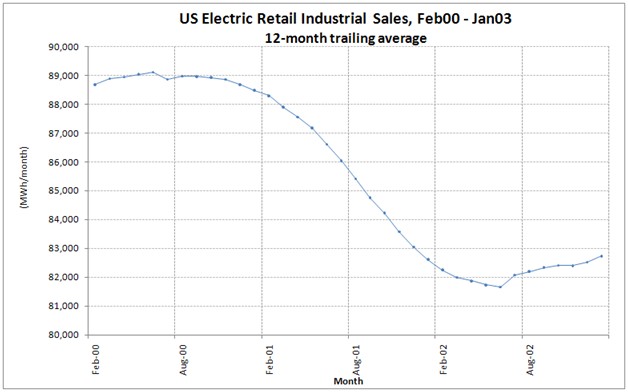
The following breaks out retail sales by residential, commercial, and industrial customers (per DOE/EIA classifications). Let’s look first at the downturn during the S&L crisis. To see trends, I’ve shown data from 12 months before the downturn to 12 months after the economy recovered.
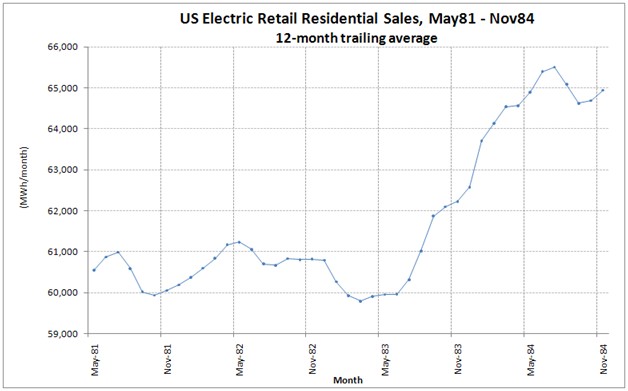
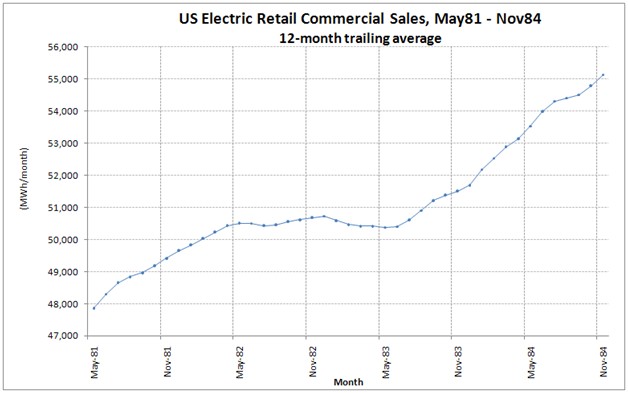
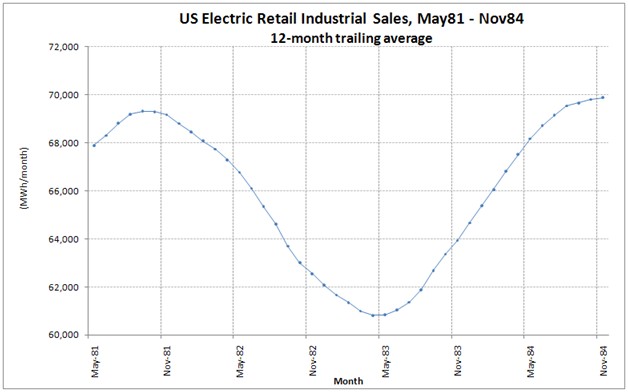
In the residential and commercial sectors, a slight (1-2 percent) reductions in electricity purchases quickly rebounded, with trend growth in demand coming back stronger after the recession. The industrial sector fell much farther on a gross and relative basis (about 12 percent from peak to trough), but rebounded strongly.
Now fast forward a decade to the downturn after the first Gulf War in the early ’90s:
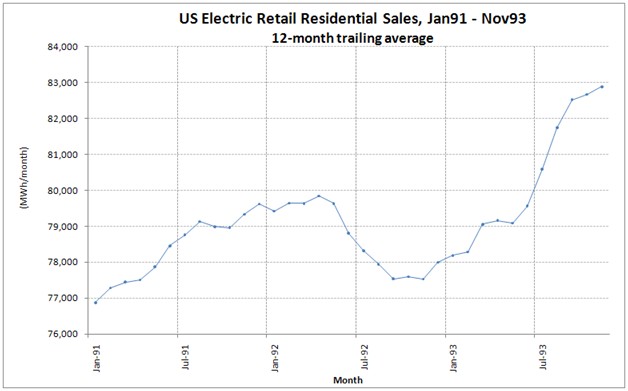
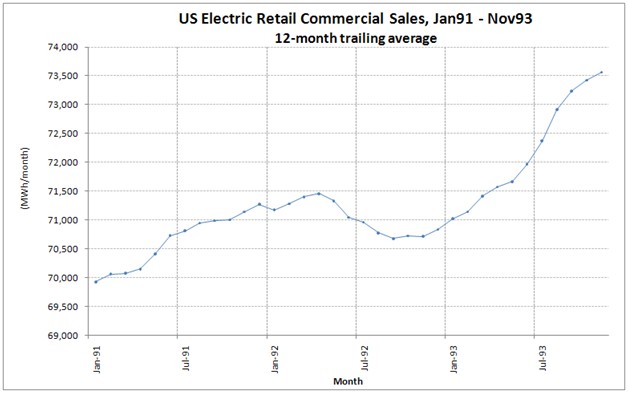
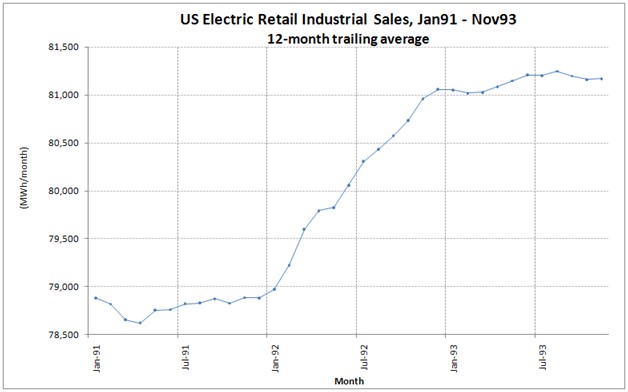
For the residential and commercial sectors, the trend is very similar to the S&L downturn: 1-2 percent drops in electricity sales followed by a strong rebound. For the industrial sector, Gulf War I appears to have been a pretty good war, with no obvious change in their energy demand other than (perhaps) a slight slowdown in the overall rate of growth. But note the relative percentages. In 1981, the industrial sector was responsible for 39 percent of U.S. retail electricity purchases. Ten years later, it was responsible for 35 percent of retail electricity purchases.
Now let’s move forward another decade to the 9/11 downturn:
Residential and commercial sales tell a familiar story. But industrial sales seem to portend a functional shift at this point: they fall hard and never recover. By the end of 2002, industrial sales have fallen to just 29 percent of retail electricity sales. To the extent that electric sales are a bellwether for economic activity, this may have been the point where our economy fundamentally changed. Going forward, we were dependent on retail purchases and housing starts. Hindsight is 20/20 of course, but the differences with the prior two downturns are rather striking.
Now let’s look at the last 36 months:
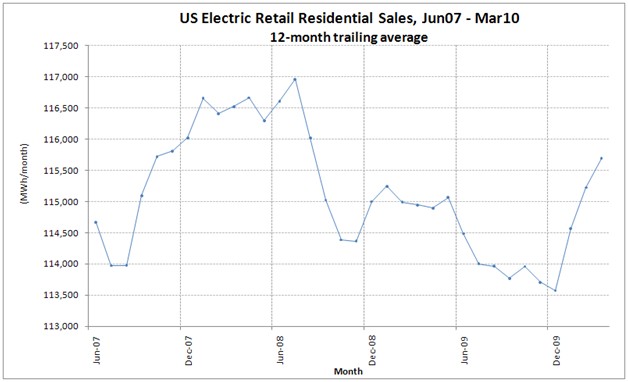
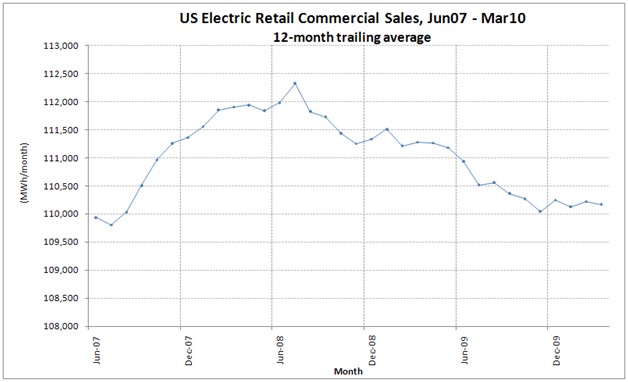
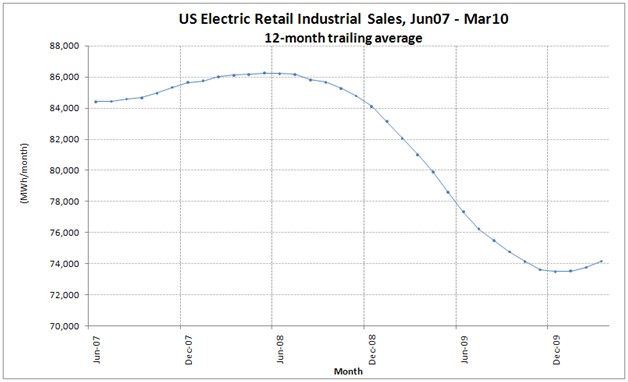
Residential fell by its usual 1-2 percent and has now rebounded, just about all the way to pre-downturn levels. Commercial has fallen and not recovered at all (witness all those empty office buildings and retail spaces). Industrial has collapsed utterly, falling by 14 percent and barely recovering. Maybe we’re at the start of a bigger industrial recovery … or maybe we’re at the start of another round of deindustrialization, following on the trends seen in 9/11. As of March of 2010, industrial electricity sales were down to just 25 percent of U.S. electricity purchases.
Some observations:
1. Politically, if economic activity predicts the winner of the next electoral cycle, Democrats better hope for a rebound in industrial activity — residential looks to be about tapped out.
2. We shouldn’t be too encouraged by the recent reduction in U.S. CO2 emissions. With the downturn so heavily skewed towards the energy-intensive parts of the economy, and with those parts of the economy being the most subject to global competition, we may simply be offshoring our pollution. Industrial economic activity must become a more important part of an effective energy and climate policy; if it’s not, we will simply be transitioning to an economy that is ever more dependent on housing starts and big box retail to sustain its growth.
3. These trends could carry unwelcome political consequences for clean energy generation assets. It’s a lot easier to build the “right” generation when it doesn’t implicitly require a shutdown of the wrong generation. Absent a rebound in industrial demand, we might be seeing a permanent slowdown in the rate of U.S. electricity demand and a corresponding reduction in the need for new generation construction.
Interesting times.
A message from
Your support keeps our climate news free. All donations DOUBLED!
Grist is the only award-winning newsroom focused on exploring equitable solutions to climate change. It’s vital reporting made entirely possible by loyal readers like you.
At Grist, we don’t believe in paywalls. Instead, we rely on our readers to pitch in what they can so that we can continue bringing you our solution-based climate news. Donate today to keep our site free. All donations DOUBLED for a limited time.