My colleague Nick Zigelbaum posted this on his NRDC Switchboard blog. Nick is NRDC’s lead advocate on California building policy and has worked extensively on efficiency policies in China. He’s a fellow engineer and his blog is a great resource for thoughts on California and all things building related.
I developed the following graphic for a presentation to a visiting Chinese delegation. I believe it sums up our building energy efficiency strategies simply and effectively.
An Explanation:
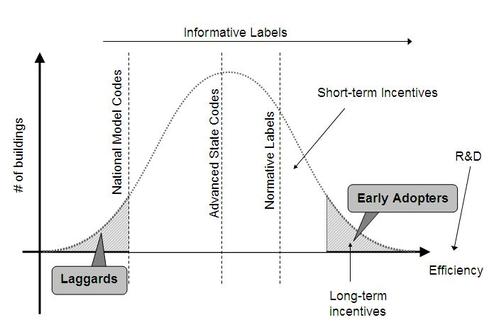
The dotted line curve represents a rough idea of the new construction market in the U.S. The y-axis intimates a informed assumption of all buildings and the x-axis shows the relative efficiency of those buildings. We assume the buildings market would shape out a bell curve when measured on efficiency, as do most statistical analyses.
The far left piece of the graph represents the least efficient buildings built every year. These are the buildings in states without mandatory codes and non-compliant buildings in states with very weak mandatory codes. We call these buildings laggards.
The far right shows early adopters; those who build the most efficient buildings as part of a pilot project, research and development, competition, or just to say they could do it.
Beyond this, the graphic illustrated NRDC’s policies regarding buildings, from left to right:
- Rigorous mandatory minimum codes to compress the tail to the left (ASHRAE, ICC)
- Development and adoption of advanced state codes (CA Title 24) and reach codes (NBI’s Core Performance) to increase the height of the bulge in the middle.
- Normative Labels (LEED, ENERGY STAR) to draw builders to the right and move the middle.
- Short-term incentives (utility programs, retrofit incentives, financial incentives) to make it worthwhile to pursue beyond code practices and achieve normative labels.
- Long-term incentives (tax-incentives) to encourage development in more efficient technologies and expand the right tail.
- Focused research and development funding to push the right tail as far to the right as possible.
- Finally, informative labels (RESNET, COMNET, ENERGY STAR) to inform the market and provide choice to consumers. This strategy simply allows the market to function and make apparent the differences in efficiency.
With these strategies combined, and with the refinement of each of the above bullet points each year, the buildings market can function properly, promote efficiency and draw the country into a cleaner future. Of course, this is easier said than done. Each of these strategies has obstacles to overcome and opportunities for growth. In my next blog I hope to elaborate on these challenges and opportunities.