(Part of the How to Talk to a Global Warming Skeptic guide)
Objection: One hundred and some years of global surface temperatures is not long enough to draw any conclusions from or worry about anyway.
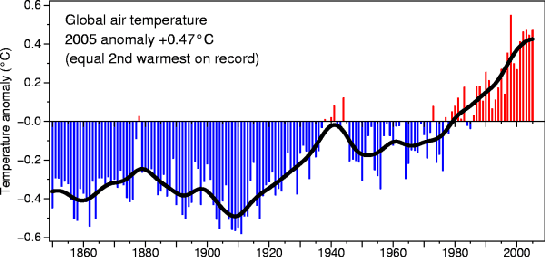
Answer: The reliable instrumental record only goes back 150 years in the CRU analysis, 125 in the NASA analysis. This is a simple fact that we are stuck with. 2005 was the warmest year recorded in that period according to NASA, a very close second according to CRU. Because of this limit, it is not enough to say today that these are the warmest years since 150 years ago, rather one should say 'at least':
1998 and 2005 are the warmest two years in at least the last 150.
![]()
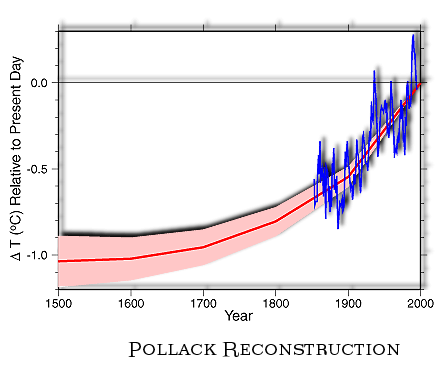
But there is another direct measurement record available that can tell us things about temperature over the last 500 years, and that is borehole measurements. This involves drilling a deep hole and measuring the temperature of the earth at various depths. It gives us information about century-scale temperature trends, as warmer or cooler pulses from long term surface changes propagate down through the crust.
Using this method we can see that temperatures have not been consistently this high as far back as this method allows us to look. This way of inferring surface temperatures does smooth out yearly fluctuations and even short term trends, so we can not know anything directly about individual years. But given the observable range of inter-annual variations recorded over the last century, it is quite reasonable to rule out single years or even decades being far enough above the baseline to rival today.
Using this record, we can reasonably conclude that it is warmer now than any time in at least the last 500 years.
![]()
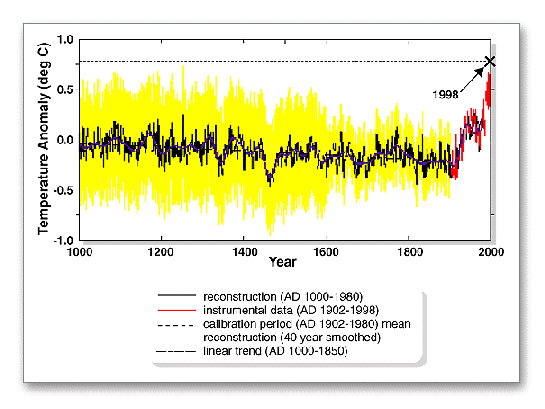
It is possible to make reconstructions of temperature much further back, using what are called proxy data. These include things like tree rings, ocean sediment, coral growth, layers in stalagmites, and others. The reconstructions available are all slightly different and provide sometimes more and sometimes less global versus regional coverage over the last one or two thousand years. Note: this covers what is often referred to as the Medieval Warm Period. As noted, all these reconstructions are different, but ...
... they all show some similar patterns of temperature change over the last several centuries. Most striking is the fact that each record reveals that the 20th century is the warmest of the entire record, and that warming was most dramatic after 1920.
Thus, we can reasonably say it is warmer now than any other time in at least the last 1,000 years.
![]()
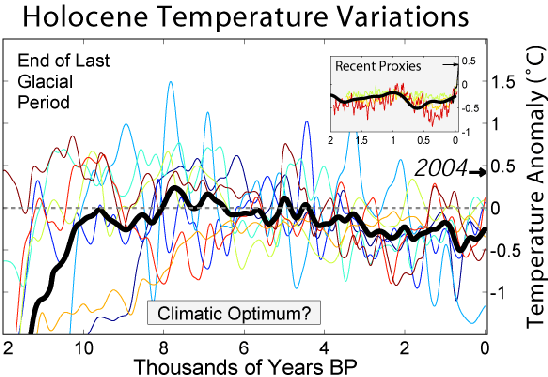
The only other candidate for a higher temperature period -- going back through the entire Holocene (~10,000bp to now) -- is called the Holocene Climatic Optimum some 6,000 years ago. It is not known exactly what the temperatures were then; the farther back in time we try to look, the greater the uncertainties. Even so, the Holocene Climatic Optimum has long been cautiously thought to be almost as warm or even warmer than now.
That conclusion is starting to look less likely, as it has been determined that the anomalous warmth of that time was actually confined to the northern hemisphere and occurred only in the summer months.
Robert Rohde's website, Global Warming Art, has a nice graph of many reconstructions of Holocene temperature, regional and global, all super-imposed with an average of all of them combined, shown below. This represents the best estimate available of global temperatures in the Holocene.
Thus, we can reasonably believe it is warmer now than at any other time in at least the last 10,000 years.
![]()
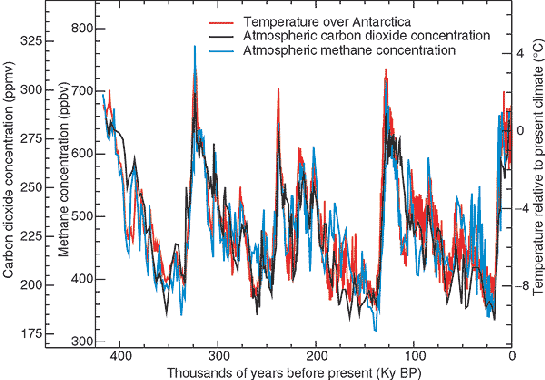
Before the current interglacial, the planet was in the grip of a much colder glacial period with ice sheets well down into the continental U.S. This period ended just some 11,000 years ago. The record of glacial-interglacial cycles can be read in Antarctic ice core analysis, and it shows these cycles over many 100Kyr periods. The IPCC offers a good version of this graph.
If our reading of the Holocene is correct, it is warmer now than at any other time in over the last 100,000 years.
![]()
And that is a bit more than 100 years. It is, in fact, the entire history of our species.
Comments
View as Flat
TokyoTom Posted 6:09 pm
29 Oct 2006
In addition, each graph that refers to "years BP" should specify exactly what year they refer to as the present.
Permalink
wacki Posted 6:42 pm
29 Oct 2006
Heck I don't even like using the multi line hockey stick.
Permalink
jjh Posted 10:13 pm
06 Nov 2006
Why is your Holocene graph so horribly difficult to read ? I can't tell the difference between the lines representing the temp. over Antarctica and the amount of methane in the atmosphere. All I can tell is that the current temperature is a bit on the high side, but not as high as it has been previously and because all the lines are on top of each other, I can't see with any accuracy what temperature was at any of the other peaks on the graph.
Your proxy data graph shows what appears to be a wide range of (unlabeled) yellow proxy data but why does all the non instrumental data show a perfectly linear decline in temperature ? Is it something to do with the "calibration period mean reconstruction" ? Again I can't tell which line is the dashed one and which one is solid black - I'm not even sure if the dashed line is straight or wiggly.
You're not alone in this practice, watching 'An Inconvenient Truth' I found myself constantly frowning and trying to read the (often non existent) axis labels and scales. I was never able to satisfy myself that the whole thing wasn't just a graphical variant of "lies, damned lies and statistics".
Permalink
Biodiversivist Posted 1:50 am
07 Nov 2006
In the end, it all comes down to biodiversity. Help acquire and protect ecological hotspots, give to a conservation organization: http://www.saveourbiodiversity.com
Permalink
Coby Beck Posted 9:04 am
10 Nov 2006
Some good points about the graphs, holocene in particular. I realize that there is not enough meta information, like legends. I'll look into updating it, maybe wacki is right and the holocene spaghetti graph just doesn't help. The 400K yr ice core is probably not all that relevant either.
Invent a clever saying, and your name will live forever!
-- Anonymous
Permalink
DaveR Posted 3:55 am
15 Feb 2007
Any news on whether you'll be able to at least link the graphs to articles on the web that make them understandable and include legends and proper explanations of what all the lines mean and how one gets from the lines to the conclusion that it is warmer now than it was then? As someone else has said above, the blue line on the Holocene graph on this page does make it look like the Holocene was far warmer than today, even though it wasn't actually!
Dave
Permalink
Delay And Deny Posted 4:47 am
01 Mar 2007
Samples of rock drilled out of the Antarctic seabed show there has been a surprisingly wide variation in the world's climate over the past 3.5 million years, a German geo- scientist said on Tuesday.
"It's blown away the prevailing wisdom that we had a steady cold phase during this era," said Lothar Viereck-Goette, a professor at the University of Jena who is examining rock raised by the four-nation Antarctic Geological Drilling (Andrill) project.
"That means that climate variation is something normal, not out of the ordinary," he said.
The drill site was in the seabed under the Ross Ice Shelf, where sediment provides evidence of expanding and contracting ice sheets.
http://www.news24.com/News24/Technology/News/0,,2-13-1443 ...
The Texeme Construct offers international text memetics construction and textcasting services.
Permalink
VillageIdiotSavant Posted 9:41 am
11 Jun 2007
I was almost shocked to see THAT graph in HERE... it just looks so ... so ... scientific, and to be ALMOST of a large enough scale to matter in a 4+ billion year frame of reference.
This graph just has an insidious way of making me ask myself (and any bring-back-the-colden-days GW zealots I happen to be near):
"what has been happening so consistently every 100,000 years, for the last half millenia or so? Was it us... then...?"
But this time... this time it's US, I tell you...ignore the silly repeating patterns you see so plainly before your eyes - and pay no attention to that little man behind the green curtain.
Your post almost came right out and acknowledged the fact that we are not even at the inflection point we've reached - and measured - at least 4 times in our recent, half million year past.... nor how awful things get - cold-wise - for our home planet, once the temperature down-turn begins again. Its probably best to leave this inconvenient graph out... there is not one aspect of this much larger picture that is helpful to proponents of man-made GW.
(I sincerely hope the folks subscribing to the 120 year temperature graph are the same ones making stock picks using the one-minute stock chart view... easy pickings for those of us who appreciate a more rational frame of reference. )
Permalink
trickytank Posted 10:16 pm
14 Jun 2007
Scientists would agree that climate change is a normal phenomenon, and is ongoing. What is not normal though, is our rate of climate change.
Permalink
Micawber Posted 1:32 pm
15 Jun 2007
But it only takes a ten degree rise by 2050 to have serious consequences, so how is ai's rebuttal relevant?
Permalink
Micawber Posted 6:51 am
16 Jun 2007
There is such a thing as a valid appeal to authority, and appealing to climatology with respect to global warming is a case in point if ever there was one.
Climatology is a complex science. That is why it took so long for climatologists to reach a consensus opinion, and it is why anyone who looks for quibbles can easily find them.
Yet for those of us who are not climatologists, the matter is quite simple. As far as we are practically concerned, there are just these facts in evidence, all of which are the consensus opinion of climatologists:
---------------------------
That certain gases, notably CO2, can trap heat, causing a greenhouse effect.
That human activity since the industrial revolution has increased the sources and reduced the sinks of these gases.
That it is predictable that the level of greenhouse gases in the atmosphere should generally increase since the industrial revolution, and that the increase should be ever greater as industrialism spreads and intensifies.
That such an increase is observed
That, absent a contrary natural trend, there should be a corresponding upward trend in global average temperatures.
That such a trend is observed.
And finally, that even a seemingly small increase in average global temperature--2.5°C, say, can have surprisingly large impact.
---------------------------
The rest is charts and graphs. I don't find those on this page confusing. They generally yield to a couple of minutes of focused attention. It seems to me that respondents who find them confusing (often with the implication that the confusion is deliberate) are scrunching up their eyes a bit. Had the graphs been simplified more than they are, the criticism could be to mistrust the simplification.
Those of us who are not climatologists can dispute the above facts in just two ways:
1. By attacking the majority argument and data as simply mistaken.
2. By impugning the motives of the majority.
We amateurs are not qualified for the first option. The second leads to lunatic conspiracy theories which simply cannot be taken seriously, and which, in any case, would have to be supported by a hostile version of option one.
Permalink
RealityExplorer Posted 2:49 pm
21 Jun 2007
Its just like the scientists in the 70s claiming an ice age was about to happen.. they weren't aware that they didn't have enough information to make that prediction. New information caused them to throw out those predictions and instead predict global warming.
The question is whether the past natural variation which the current period seems to match with is more information out there that is still not understood which makes any claims of certainty of current predictions just as irrational as the claims of certainty re: a coming ice age were before.
Until the factors underlying the past variability are understood.. and modeled well.. the human element can't be isolated out with any rational certainty.
The long term temperature graph seems to show that recent temperature trends might be caused by the same factors which caused past climate variability and that the hypothesis that "temperature changes could only be due to human intervention...there is no chance its due to factors we don't understand yet which swamp human factors..." doesn't seem very credible until all the factors involved are understood. It could be a complete coincidence that natural warming is occurring at the same time humans having been emitting larger amounts of gas into the environment. Or it could be that we've only made slight changes to the timescale of warming that was going to happen anyway. If its going to happen anyway.. then humans need to adjust to the warmer temperatures and stop wasting time worrying about stopping them.. (or focus on potential ways to counter effects such as sequestering carbon dioxide even beyond the human level of emissions... and the technology to do that is likely easier to develop and fund than is lowering emissions anyway).
If the assumption is "humans dumped X into the atmosphere, there must be some warming effect.." the issue is whether with a lack of understanding of all the effects involved.. if there is any likelihood that current climate models are able to separate out the natural climate change factors from the human factors in a logical fashion (vs. assuming a worst case, "no, there can't be any damping mechanisms, or natural warming, it must be all due to intervention of evil humans")
If there are huge factors not understood the models may be completely out of touch with future reality even if eg arbitrary tweaking of 300 tweakable parameters to the models let them match the current data.. It may be its matching for the wrong reasons if a huge natural factor is being ignored.. and that if the data matches without that factor being included that may indicate that the models are really flawed if they are fudged to work without that factor.
for all we know the warming could stop.. or it could plunge into an ice age unless we keep up carbon emissions and increase them.. or it could warm much faster than expected..
The issue is whether the current climate models are based on sound science when ignoring natural climate variability due to factors not currently understood as potential factor in the current warming. If the models are ignoring natural climate change factors which simply aren't yet understood... then the results of those models claiming X degree temperature rise may be out of touch with reality and not something to rely on (and I don't think any are claiming 10 degrees by 2050 anymore).
Permalink
Micawber Posted 8:12 am
23 Jun 2007
And the consensus opinion among climatologists--as opposed to amateurs--is that as far back as we can reliably measure, the climate has not been warmer than today. (It may have been in the late Permian, but--oh yes--that caused rather a large mass extinction event.
I don't recall that an immanent ice age was ever a consensus opinion among climatologists (you had to reach all the way back to the 70s? Source, please). What were they using for computers, then. For models? How much less data did they have, and how much less accurate? Do you think that thirty-odd years might have improved understanding? Shall we delay action another thirty years in the hope that climatologists will reverse themselves?
Recently, some climatologists thought an ice age might be a consequence of global warming (increased cloud-cover reflecting more sunlight along with changes in heat-distributing oceanic currents caused by melting & desalinization. CO2 only traps heat. If there's none to trap...) Over time, science converges on the truth. It does not flip-flop randomly.
For global warming to be a natural trend, there would have to be a natural cause. Heat can't just appear from nowhere. I was able to find an AP reference to a 1997 study by Richard C. Willson of Columbia University's Center for Climate Systems Research which found the sun is contributing to global warming, but not by much: just 0.72 degrees in 100 years. (lubbockonline.com/news/092897/study.htm). The effect by itself cannot explain global warming and would not be dangerous save that it contributes to human-caused global warming.
A 2004 London Telegraph headline trumpeted that "the truth about global warming is it's caused by the sun," but the text of the article didn't support this claim. They were citing (they said) a study by Sami Solanki of the Max Planck Institute for Solar System Research, who said (according to the article) only that the sun was contributing to human-caused global warming and it was difficult to say which was contributing more.
On visiting Dr. Solanski's home page, it appears that he is not very excited by this remarkable result--it isn't featured, nor could I find it in the list of his publications. Digging deeper, it turns out that the institute has, in fact, come to the opposite conclusion: The sun is not contributing significantly to global warming. Apparently, one should not get one's climatology from the London Telegraph.
So it's not the sun. Could it be something else?
How about the earth's core? Nope, that's cooling.
Volcanic heat? They're not putting out that much heat, and vulcanism is trending (very slowly) downward.
Volcanic CO2? Concedes the point that CO2 is a greenhouse gas, and volcanoes are not putting out nearly as much CO2 as we are.
That pares the list down to humans and magic heat faeries. I vote for humans.
It is not a thesis of human-caused global warming that humans are evil, only that we don't know our own strength.
All of which is beside the rather obvious point that we'd better hope global warming is caused by humans, because if is, we can help ourselves before it gets serious. That such is the consensus opinion of climatologists, and that it agrees well with common sense (unless one does believe in magic heat faeries) is cause for relief.
Even if global warming had a natural cause (suppose our measurements of solar radiation were way off) we could still mitigate it by reducing greenhouse gases, and that would have to be an important part of whatever hunker-down strategy we might devise. The only strategy that's guaranteed not to help is putting our heads where the sun don't shine.
Permalink
Micawber Posted 6:30 am
24 Jun 2007
If this theory is right then this graph could be misleading if we calculate the amount of solar heat contribution from the sun's increased radiance alone. We must also take into account a reduction of average cloud cover that will permit more of it to reach the ground.
(On studying the graph more carefully, I'm not so sure. Solar radiation is effectively flat since @1940. Per Svensmark's theory, cloud cover and additional sunlight reaching the ground should also be flat. That the solar contribution may get a boost from reduced cloud cover doesn't matter--it's still flat. If the solar contribution is significantly greater than CO2, the global temperature curve should flatten, but it clearly follows the CO2, not the sun)
Svensmark's theory is contingent upon two foundation theories: First, that increased solar activity shields the earth from cosmic rays (among other causes, the sun's magnetosphere increases). I presume this can only be tested indirectly. Second, that cosmic rays stimulate cloud formation through ionization. As far as I can tell from the interview, only one experiment, or a series of experiments using the same apparatus, has be conducted to demonstrate this. Other experiments are underway.
There is a book, The Cooling Stars co-written with Nigel Caulder. The first chapter is not promising. It begins by presenting archaeological finds in the Thun which indicate a history of advancing and retreating ice. But climate doesn't vary in lockstep in every part of the world, so the implied argument is specious. I think I'll pass, for now, and wait for the results of future experiments.
In the interview, Svensmark restates the popular misconception that the climate models don't include clouds, and also mentions the little ice age as agreeing with a period of increased solar activity. But the little ice age was a local phenomena. His theory calls for climate to have cooled globally.
Even so, I think Svensmark's theory is falsifiable, makes testable predictions and is worthy of testing.
Discovery's article, I'm sorry to say, presents Svensmark as a lone hero doing battle with reactionary dogma (boo, hiss!). I'll let Richard Dawkins reply (from an afterword to Dangerous Ideas currently posted on the edge.org):
...Although it is true that hindsight can recognize accepted norms that were once dangerous ideas, it is also true that most dangerous ideas from the past neither deserved nor received eventual acceptance. It is not enough for an idea to be dangerous. It must also be good.
For the present, Svensmark's opinion is very much a minority opinion among solar scientists and climatologists. It may win converts, it may not. He acknowledges that CO2 is a contributing factor to global warming, though perhaps less than currently supposed. Even if his theory proves to be correct, it would not change our strategy vis greenhouse gases. If the sun is warming our planet, we don't want to help it.
To which I must append that if Svensmark is right, then my "magic heat faeries" are present and accounted for in the form of his cosmic rays. (Every time I yield to sarcasm...)
Permalink
wlpeak Posted 5:35 am
07 Aug 2007
This is Science. A 'Consensus' only occurs when a subject is so well understood that even the most obnoxious grant grubbing grad student can't find one more aberrant measurement.
Every day the data change and if we honestly follow their lead we will be doing 'good' Science and our theories will be more Copernicus than Ptolemy.
In the Science of the Climate, nothing is static, but much is noise.
Permalink
kman Posted 9:05 am
01 Sep 2007
http://www.pubs.royalsoc.ac.uk/media/proceedings_a/rspa20 ...
Furthermore, the low cloud quantity and cosmic ray flux relationship breaks down after 1990 or so. Also, there is a a 6 month lag between cosmic ray flux changes and temperature increase in the parts that they do match. While Svensmark claims that this is due calibration issues, ISCCP which does the monitoring of cosmic rays disagrees. Finally, if ionizing radiation does cause increased low cloud cover, then it should have done so during the chernobyl incident.
In short, while the cosmic ray theory is very interesting, and a few experiments suggest a relationship between cosmic ray fluz and cloud forming nuclei, the theory doesnt hold up strong enough against the accelerated warming since 1970 or so. Even the recent analysis by Solanki at the Max Plank institute (which takes into account the cosmic ray flux)doesnt hold up.
Permalink
randy33 Posted 11:37 am
15 May 2008
Thanks for the graphs, Coby. But I think the graph which is most instructive is the famous one you suspiciously neglected to include:
http://tinyurl.com/39gnm4
Permalink
intimidavid Posted 4:44 pm
02 Jun 2008
But I guess the implication is that because it's so closely correlated with CO2 and methane, we might have a chance if we reduce the two.
Am I right? Was there anything notable about the other warm events that isn't happening today?
Permalink