Nibbling on the data nuggets found in this “Food Consumption in America” infographic delivers a real jaw-dropper, showing the literal weight of an average American’s food choices in a typical year.
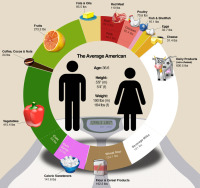
According to the graphic from banking site Visual Economics, which combines data from sources such as the USDA, FDA, and CDC, the average man is 5’9″ and weighs 190 pounds, while the average woman is 5’4″ and weighs 164 lbs. A quick check of the Mayo Clinic’s Body Mass Index calculator shows that both Joe and Jane Sixpack are thus overweight, with a BMI of 28.1 — 30 and above is classified as obese.
When you look at the breakdown of breakfast (and the many meals that follow), it’s obvious why. The average American ingests 1,996.3 pounds of food per year. That includes the sweetly sickening statistic that we annually swallow 141.6 pounds of sweeteners (42 of them from corn syrup). We eat a lot of animal products — 62.4 pounds of beef, 46.5 pounds of pork, and 73.6 pounds of poultry, mostly chicken — and 600.5 pounds of dairy products other than cheese (an additional 31.4 pounds). And we go for the Big Gulp, downing a gallon of soda a week.
 Click for a larger version.Graphic: Visual Economics
Oddly, the graphic also shows Americans eating 415.4 pounds of vegetables and 273.2 pounds of fruit. That’s more than 2 pounds of the healthy stuff per day, which seems highly unlikely. As The New York Times reported last week, despite the success of recent “extreme baby carrot” marketing campaigns, Americans are just not eating our vegetables. We far prefer to snack on the stars of This is Why You’re Fat and Grist’s WTFood series.
Which may also help explain why America leads the world in healthcare costs, as this other Visual Economics chart shows. Burp!