A while back I did a roundup of reports. I left one out because I wanted to highlight it in its own post:
Synapse Energy Economics Inc.: Costs and Benefits of Electric Utility Energy Efficiency in Massachusetts [PDF]
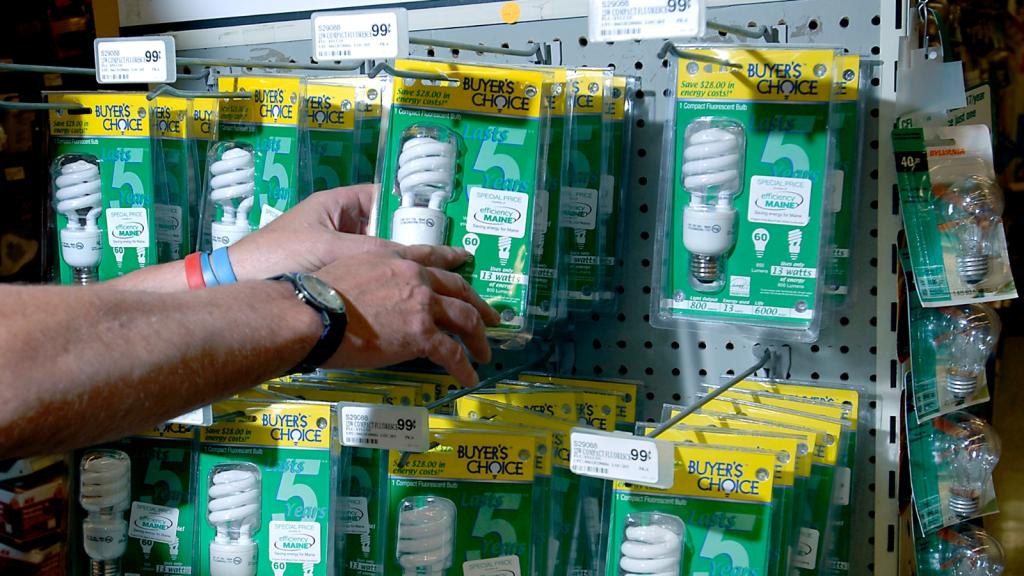
Massachusetts recently passed the Green Communities Act, which significantly ramps up the state’s utility efficiency programs, mandating that "electric and natural gas resource needs shall first be met through all available energy efficiency and demand reduction resources that are cost effective or less expensive than supply." This puts the state at the head of the pack in terms of these kinds of programs.
So which "energy efficiency and demand reduction resources" are cost effective? That’s what the report from Synapse, one of the most respected consulting firms in the field, investigates.
The report is worth reading in full, but this paragraph is absolutely vital:
Synapse recently undertook an extensive review of numerous utility and third party EE programs from across the United States in order to explore the empirical relationship between the cost of saved energy (CSE) per kWh saved and program scale in terms of first year energy savings as a percentage of annual energy sales. In the analysis, we found that the CSE tends to decrease as energy savings increase relative to annual energy sales. This finding is contrary to the idea of an energy efficiency supply curve that is often constructed to estimate economic potential of energy efficiency measures. These supply curves generally indicate that the CSE increases as energy savings increase, much like a generation supply curve would. [my emphasis]
In English: Energy efficiency gets cheaper the more you spend on it.
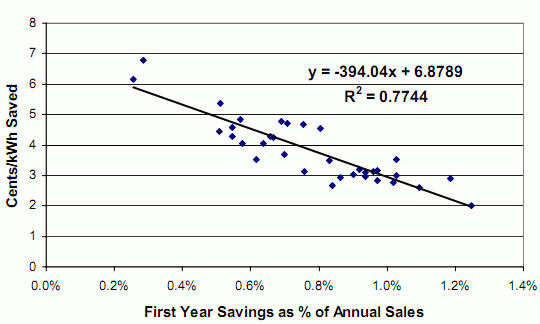
It sounds counterintuitive. For most commodities (notably fossil fuels) you get to the easy stuff first — the "low-hanging fruit." As you go after the harder-to-get stuff, you end up spending more per unit. Thus the cost curve rises.
But energy efficiency is different. As you ramp up your efforts to pursue efficiency, you get economies of scale — your cost per unit of energy saves falls as you spend more.
This fact is overlooked by most energy analysts, resulting in, as Synapse puts it, "a bias against demand-side resources in long-term energy modeling." You can say that again.
What explains energy efficiency’s inverted cost curve?
Possible reasons for the decreasing cost trends include: (1) economies of scale are at work (e.g., allocating marketing and administration costs over more savings, achieving lower unit costs for program inputs); (2) more economies of scope are at work at larger scale of energy savings relative to annual sales (e.g., exploiting synergies among different measures such as reducing the cost of site visits per measure by implementing multiple efficiency measures at one time); (3) administrators become more organized in designing and developing effective EE programs (including appropriate level of incentives to promote customer participation); or (4) administrators have more credibility or more resources available for quality program design and development.
The kinds of utility energy efficiency programs found in Massachusetts are arguably among the very few measures that can achieve the scale of emission reductions we need in the short amount of time we have. Nothing else — carbon pricing, renewable energy, carbon sequestration — is big enough and fast enough. So it’s vital that legislators and energy planners understand the unique advantages of efficiency.
If they want the cheapest possible power, they’ll spend on efficiency, and spend big.