Most people are understandably confused about the relationship between global warming and natural variability in the weather. After the huge snowfalls in the northeastern United States over the past few months, for instance, many people can’t help but wonder: With a winter of such magnitude, how can scientists say the planet is warming?
Day-to-day and seasonal weather fluctuations present challenges not only for the public but also for climate scientists trying to tease apart the relationship between long-term climate change and weather variability. Wenhong Li, an atmospheric scientist at Duke University, studies precisely this link. Her latest research on precipitation patterns in the southeastern United States offers some of the clearest evidence yet of how global warming can influence a regional weather pattern in often surprising ways.

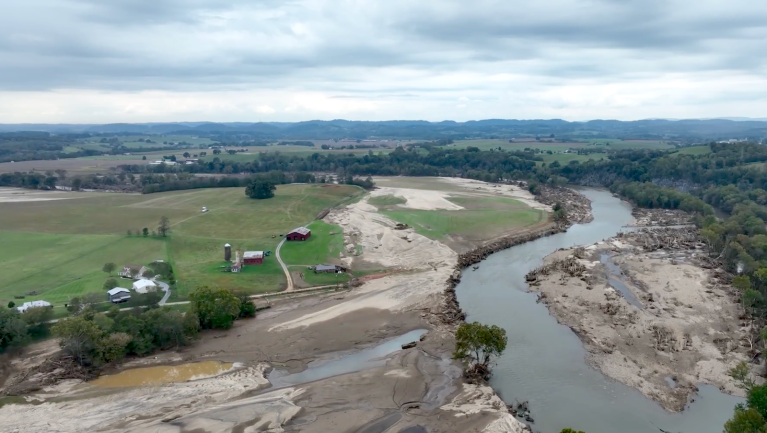
With funds from the National Oceanic and Atmospheric Administration and Duke University, Li and her collaborators set out to examine seemingly confusing trends in the region’s rainfall in recent years. A severe drought in 2007 — the worst in Georgia in a century — famously led that state’s then-governor, Sonny Perdue (R), to hold a prayer service for rain. But two years later, Georgia faced unusual late-summer flooding.
To study the problem, Li and her colleagues closely analyzed summer precipitation patterns over a longer time period. The Southeast had highly reliable standardized data compiled from local rain gauges dating back to 1948, so they used that year as their starting point. Combing through the data, the researchers calculated a “standardized precipitation index” and then looked at how often the weather deviated significantly from the norm. As Li explains, “Our first task was to analyze the precipitation patterns over time. There was no obvious trend such as an overall increase in rainfall. But it soon became clear that there was increasing variability in the precipitation pattern in the region.”
The findings were dramatic: Li and her colleagues found that an abnormally wet or dry summer in the Southeast was more than twice as likely during the past 30 summers as it had been during the 30 summers before that. From 1948 to 1977, there were just two unusually wet and two unusually dry summers — technically, “rainfall anomalies that exceeded one standard deviation from the norm.” From 1978 to 2007, however, there were six unusually wet and five unusually dry summers. Using sophisticated statistical techniques to analyze the precipitation data, Li determined that both droughts and deluges had unquestionably increased over this time period in a statistically significant way. The question was: What could be causing these large swings in the region’s summer precipitation?
Li was well suited to study the question because she had been fascinated by fluctuations in the weather long before she ever heard of global warming. As a junior in high school in China, she accompanied her father on a field trip to a weather-forecasting observatory in Beijing. It made a strong impression on her. “My father was a chemical engineer, so I knew a little bit about working with chemicals in the lab. But when I saw the vast weather-forecasting computer and the technicians in their white coats, I was amazed. I think I knew from then on that I wanted to work in this field,” she says.
When Li came to the United States to earn her doctorate in climate science, studying changes in the wet and dry seasons in the Amazon basin, she became fascinated by the effects of global warming on the mechanisms that drive these seasonal changes. As she puts it: “My work so far has focused on the interplay between global warming and natural variations in regional weather patterns.”
Li’s recent research on variability in precipitation in the Southeast is a case in point. Once she and her collaborators determined that swings of wet and dry summer weather had become more pronounced over the past six decades, they set out to see if they could correlate the precipitation patterns with other data on atmospheric and land-surface conditions. For example, they wondered whether the precipitation pattern was correlated with well-known climate cycles such as El Niño, which occurs across the tropical Pacific Ocean over a roughly two to seven-year period and affects weather patterns across North and South America. The group also looked for correlations with the so-called Atlantic multidecadal oscillation, a much longer-lived fluctuation in the surface temperature of the Atlantic Ocean that has an impact on drought in North America. But as Li explains, “The correlations were not statistically significant.”
“Based on our analysis,” Li says, “I am confident that the precipitation changes we are seeing are not caused by a natural variation like El Niño.” Instead, she explains, the group did find a strong correlation with data on the so-called Bermuda High, an area of high pressure that forms each summer in the ocean near Bermuda. It helps steer Atlantic hurricanes and plays a role in shaping weather as far away as northwestern Africa.
Li and her colleagues found that the Bermuda High — officially known as the NASH (North Atlantic Subtropical High) — correlates closely with the precipitation fluctuations in their data. “The NASH was the only parameter we studied that passed the significance test.” And the more closely they looked at it, the clearer its role seemed to be.
To pinpoint the relationship, Li drew on data gathered from weather balloons, buoys, and satellites recording changes in the extent and location of the NASH over the 60-year period from 1948 to 2007. They found that in each decade during this period, the NASH had intensified, growing in area and migrating closer to the continental United States by a little over one longitudinal degree per decade. As the NASH intensified and moved westward, Li’s group found that its north-south movement correlated closely with the precipitation data they were studying. When the NASH moved north, it increased the likelihood of extremely dry weather in the Southeast that summer. When the NASH moved slightly south, it made extremely wet weather more likely in the region.
Unlike a natural variation like El Niño, Li explains, the changes in the intensity and western migration of the NASH result from global warming — primarily from steadily rising sea-surface temperatures in the Atlantic Ocean. As she notes, “Our analysis strongly suggests that the changes in the NASH are mainly due to anthropogenic warming.” In other words, human-induced climate change has caused a prevailing weather pattern to move closer to North America; when that high-pressure area wobbles slightly to the north or south, the consequences are felt more acutely in the Southeast’s regional rainfall compared to six decades ago.
Using statistical detective work, Li and her collaborators have charted a clear link between gradually warming temperatures and increasing swings from very wet to very dry summers in a region’s precipitation pattern. The research illustrates the power of drawing strong statistical correlations in understanding the relationship between the warming planet and variability in weather patterns. In this case, Li’s work shows, global warming seems to be increasing the chance of both droughts and floods in the southeastern United States in the years ahead.
“Our understanding of the mechanisms that drive the climate system is far from perfect,” Li says. But she adds that the statistical evidence presented in her research is powerful and should not be ignored. She likens it to the statistical correlations between smoking and lung cancer, which were clear long before the mechanisms of carcinogenesis were clearly understood. “In both cases, the statistical data can give you important information that can help to avoid risk,” she says.
Already climate scientists are drawing upon Li’s work to study similar relationships between high-pressure intensifications in the North Pacific and precipitation patterns in Asia. “Every research paper I have published raises more questions for me,” Li says. “We are making significant progress, but there are still many, many questions remaining. It makes it a very exciting time to be in the field.”
This is the 16th installment of America’s Climate Scientists: A series from the Union of Concerned Scientists. Click here to read all the climate scientist profiles.
The Union of Concerned Scientists is currently leading a campaign to elevate the voices of climate scientists and educate the public about the overwhelming scientific evidence for human-caused global warming. Learn how you can get involved at www.ucsusa.org/evidence.
A message from
Your support keeps our climate news free.
Grist is the only award-winning newsroom focused on exploring equitable solutions to climate change. It’s vital reporting made entirely possible by loyal readers like you.
At Grist, we don’t believe in paywalls. Instead, we rely on our readers to pitch in what they can so that we can continue bringing you our solution-based climate news. Donate today to keep our site free.