‘Tis the season for the annual year-in-review column, beloved by writers and editors desperate to fill pages and screens of blank space during these slow news weeks.
I’m going to forgo that annual holiday journalism tradition — sort of. While perusing various year-end and year-ahead trend story pitches that had popped into my in-box since Thanksgiving, I came across one from the United States Environmental Protection Agency that caught my attention.
The EPA was releasing its annual enforcement stats for 2009. Usually that’s a big yawn, given that for most of the past decade prosecuting polluters was not high on the must-do list of the former administration. But in 2009 not only was there a much more enforcement-minded EPA administrator in Washington (in the person of Lisa Jackson), the agency for the first time created a Google map mashup of its enforcement actions for the year.
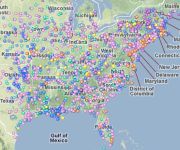
The map lets you zoom in on your city, county, or state and see the civil and criminal cases filed by the EPA for violations of its clean air and water laws and other environmental statutes. Click on the air, water, land, and criminal buttons and colored markers start to populate the map showing you the location of various violations. When you click on a marker a link to detailed information about the case pops up. You can also review any past violations.
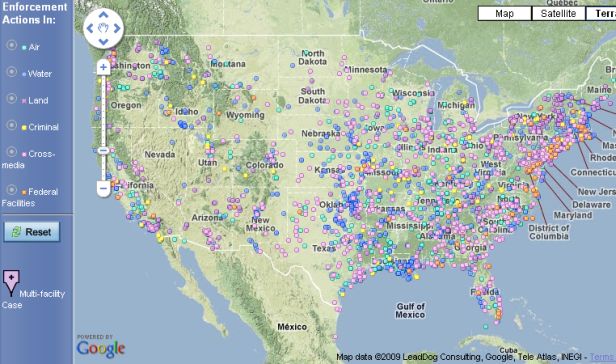 The EPA’s new interactive enforcement map could launch a new era of digital transparency.
“EPA mapped the locations of more than 90 percent of the facilities that were the subject of enforcement actions last year,” the agency said in a statement. (Note that you won’t find any drinking water treatment facilities hit with lawsuits or complaints; the EPA did not map them “due to potential security concerns.”)
Clicking around the EPA map, I learned that in Alameda County, Calif., where I live, an Oakland recycling company called California Waste Solutions paid fines totaling $172,200 for failing to comply with storm water permits at two of its local facilities. (The Bay Area was relatively law-abiding compared to, say, greater Seattle, where the map was purple with environmental violations.)
Okay, so why does this matter? Knowledge, as the saying goes, is power and the average citizen is unlikely to sift through thousands of pages of government data to find out if local companies or government facilities have been polluting their air and water in violation of environmental laws. And as metropolitan newspapers continue to gut their staffs and environmental reporters become an endangered species, you’re unlikely to read about such transgressions unless they reach oil-spill proportions or involve big money.
In contrast, the EPA’s new map and its successors will allow a quick visual comparison of the government’s enforcement actions from year to year. In fiscal 2009, the EPA said it filed 387 new criminal cases — the most in five years — and reached settlements that require polluters to spend $5.4 billion to comply with environmental laws.
Still, the new interactive map is a work in progress. First, it is not comprehensive. “While these large cases are a vital part of our work to protect public health and improve compliance, they do not reflect the totality of the annual environmental enforcement activities,” the agency said.
Second, the information that is available on violations is inconsistent, ranging from detailed to sketchy. Click on a big enforcement action or high-profile case, and you’ll get plenty of data. But many other cases just offer cryptic references to violations of environmental statutes, making it difficult to ascertain if a company is guilty of dumping toxins into a local waterway or just bad record-keeping. I couldn’t tell, for example, what that Oakland recycling company had done to violate its storm water permit.
I had a similar experience when I came across an air violation by an Alameda County Trader Joe’s, that Costco for the bobo set. When I tried to get details on the violation I came up short. Clicking on the map marker took me to an “Enforcement Case Report” that listed the violation as “Air Emissions Not Otherwise Specified.”
After a few minutes of clicking around the EPA database I found that the violation was deemed “minor” but no other information was available. (The EPA could take some cues from The New York Times’ ongoing investigative series on water pollution that features an interactive database that lets readers identify polluters near their homes.)
Making the map a real-time snapshot of environmental cases as they are filed rather than a static end-of-year review would make good on the EPA’s promise to “increase transparency, improve access to data, and provide the public with the bigger picture of enforcement activity occurring in communities around the country.”
The ’09 map mashup could just be the start of a new era of digital transparency. One can imagine an app that would tap the iPhone’s GPS to geotag polluters or issue alerts of enforcement actions.
Better yet, if the EPA really wants to tap the power of social media in the new year, let people create their own mashups. Just imagine an army of iPhone-toting citizen enforcers geotagging and reporting suspected environmental violations to a database monitored by their local EPA office.